Automates real-time tracking of energy, water, and other utilities. Provides immediate data analysis to optimize usage, reduce costs, and improve
efficiency.
Feature
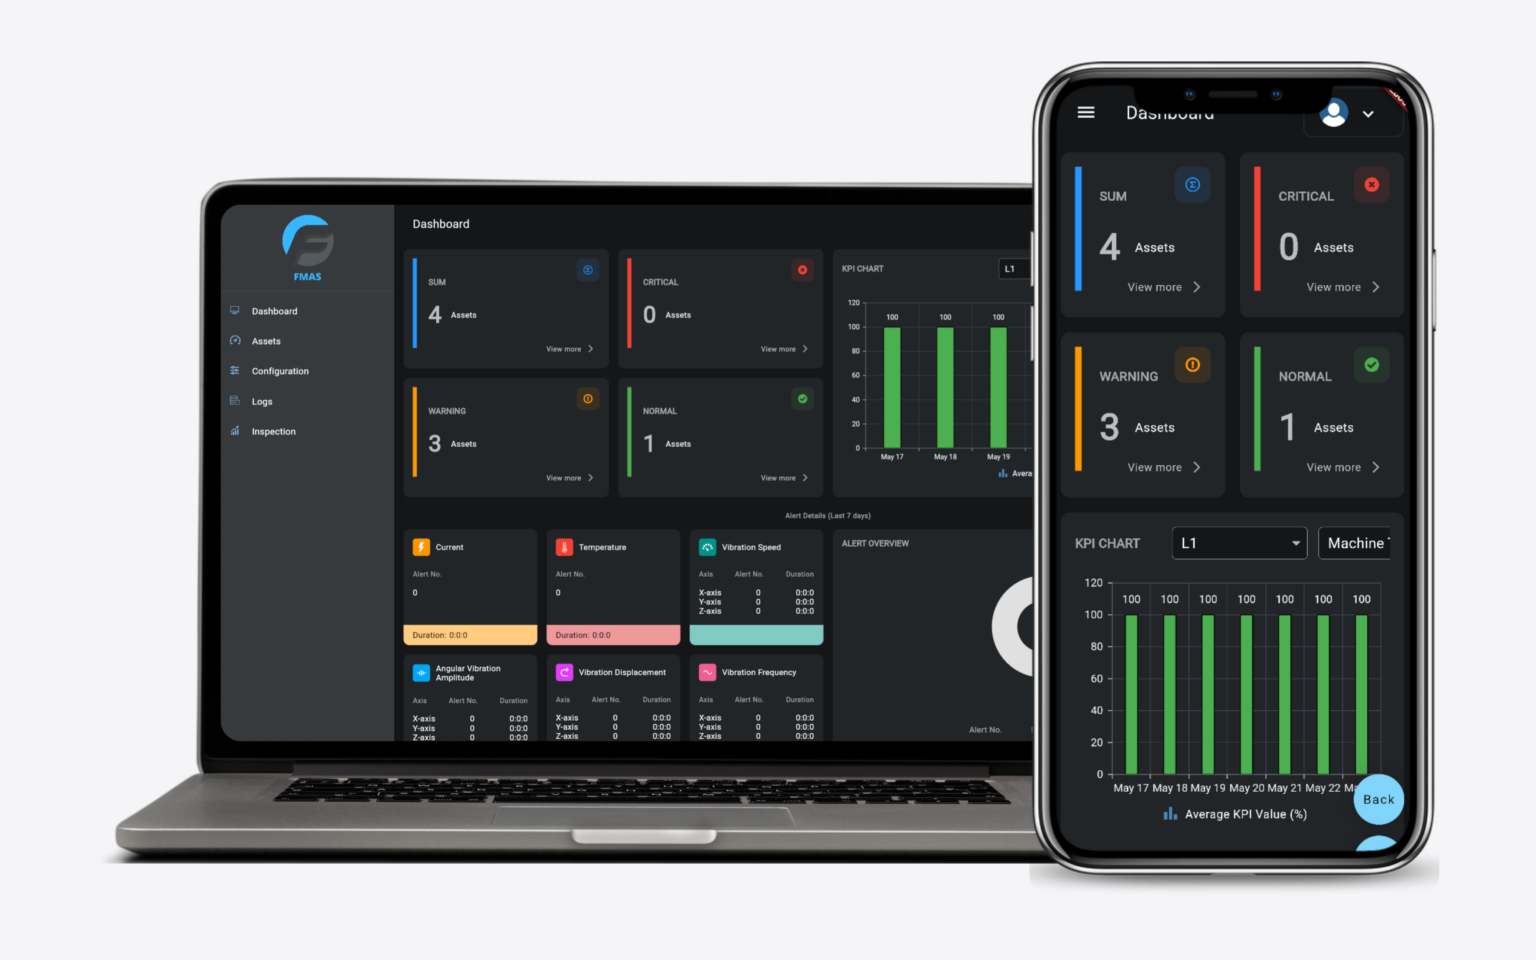
Dashboard
Helps monitor how well equipment is working
Asset Categories
View asset numbers by category, identify machines needing attention, and access details quickly.
KPI Average Bar Chart
A bar chart for specific lines and assets (with filter options). Displays the average KPI value per day over a 7-day period.
Alert Detail
Provides a quick overview of alerts, including their status and duration for each parameter.
List of Recent Alert
Quickly scan recent issues, understand their nature, and take necessary actions to address them.
Feature
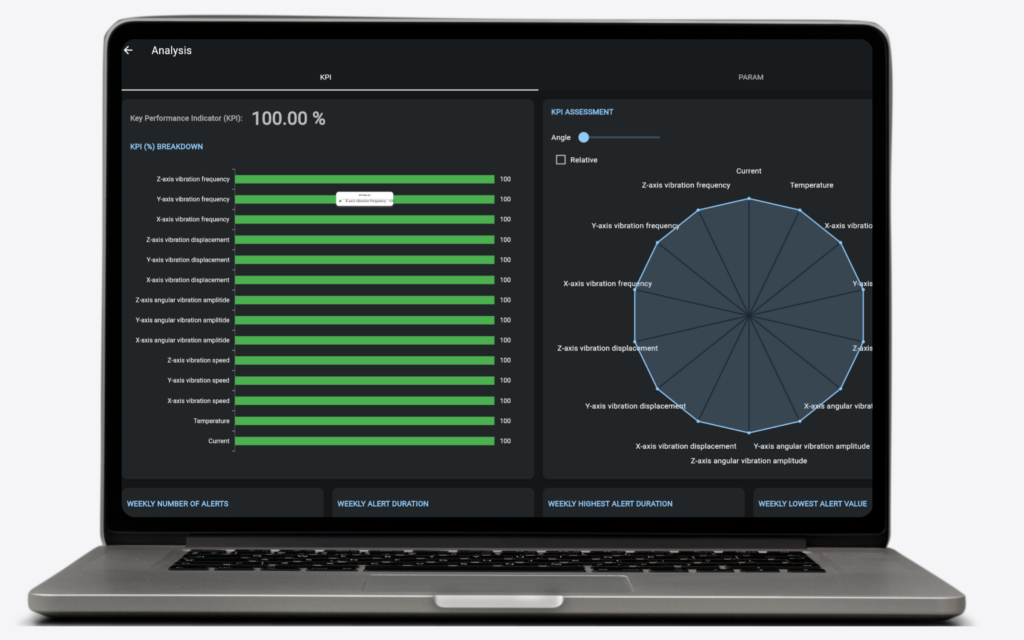
Asset Analysis
Explore Asset Insight
Filter asset by category
Filter chips for easy selection by asset category: All, normal, critical, and warning.
Connection status
Click on status active/inactive indicator to view detailed parameter connection status.
Visual percentage of KPI
Circular chart with colour indicator to signify average KPI level: Critical, warning, normal.
Deep dive
Click analysis button, and deep dive to view more comprehensive look into the asset’s metrics.
Feature
Configuration
Helps monitor how well equipment is working
Display asset operational mode – ‘Manual’ or ‘Auto’.
Easily configure asset settings through an editable form
Feature
Integrate real-time sensor data.
Helps monitor how well equipment is working
Monitor equipment health in real-time, detecting potential issues before it become major problems. Helps reduce maintenance costs by addressing issues early.
Better Together
Assets
Display list of parameters name and value based on specific line and asset in a single block. You can filter real-time data based on different assets and parameters.
Logs
Logs displays all recorded data in a table format. Users can view, edit, or delete data as needed. You can filter based on date, asset, and parameter. This flexibility ensures that users can easily manage historical data for better analysis.
Graph
Displays all recorded data along with graphical representations for easy analysis. The graph provides visual insights into the log data, making it easier to identify trends and patterns for more informed decision-making.