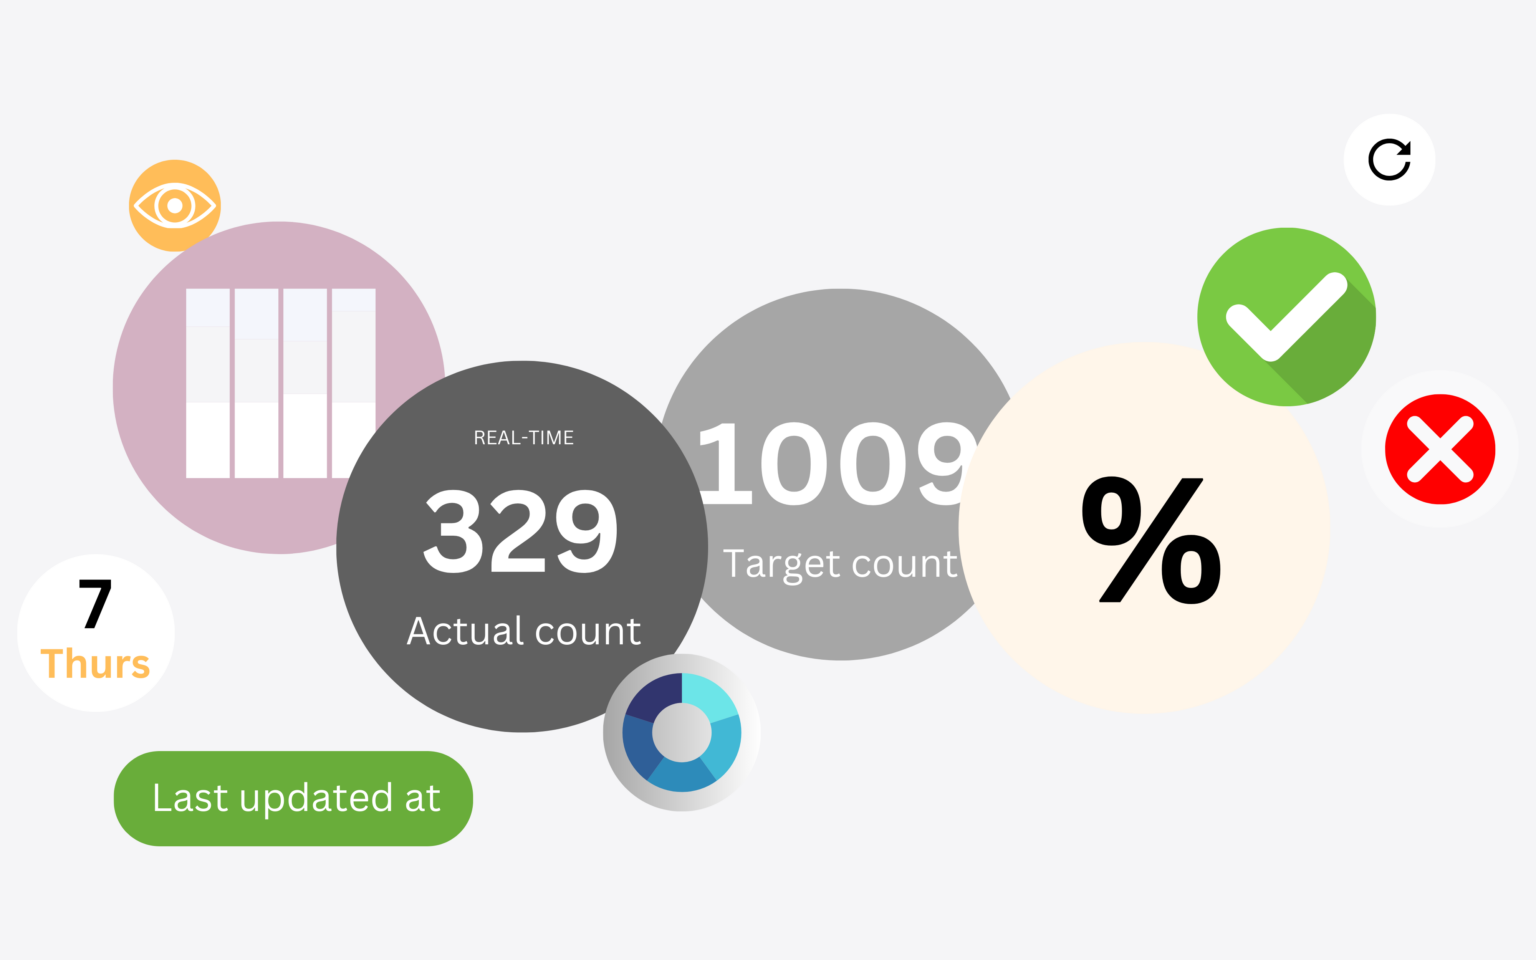
The real-time monitoring dashboard offers visualizations of crucial data. Providing an overview of all production lines on a single view. This makes it easy to interpret performance metrics, identify issues, and make informed decisions quickly.
Track actual counts with trend graphs for easy analysis.
Analyze trends
Instant updates on production count and metrics.
Clear, comfortable viewing
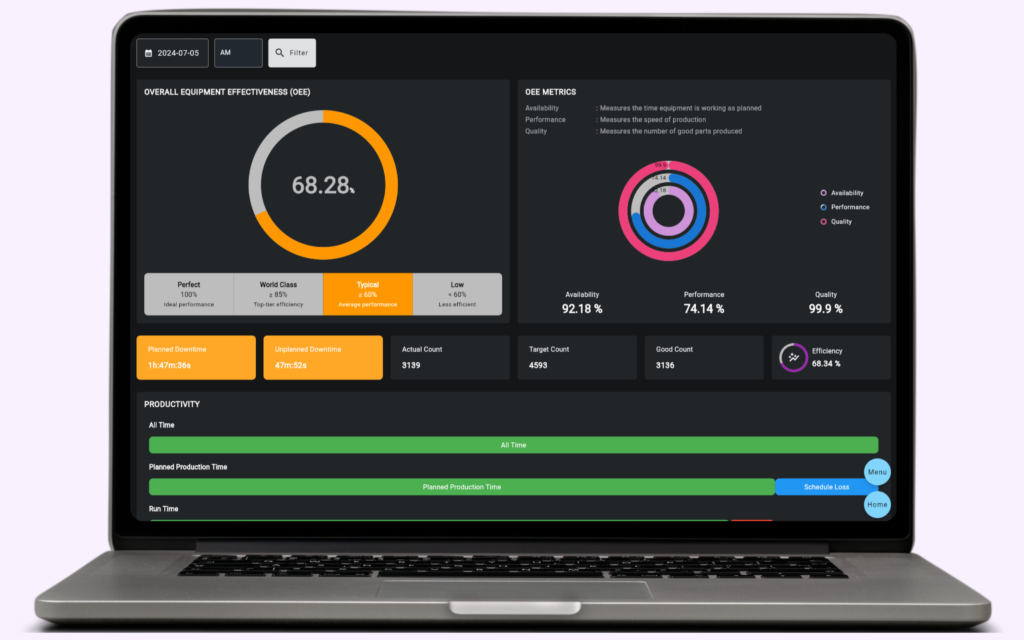
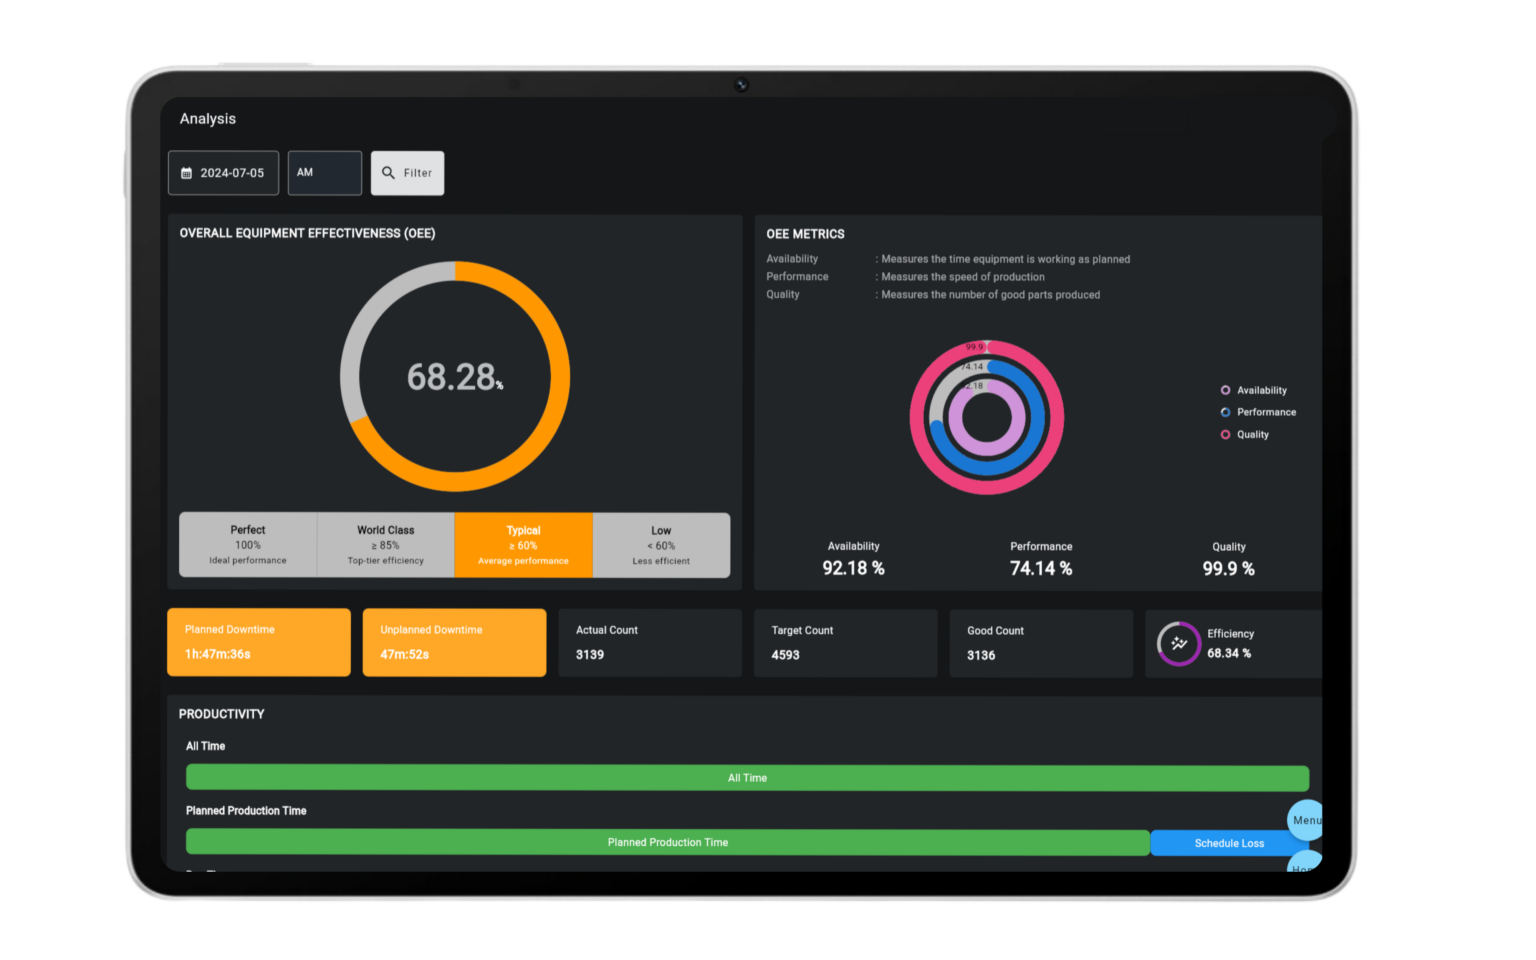
TEEP and OEE Analysis
Measure Manufacturing Productivity
TEEP Insights
Measures the percentage of All Time that is truly productive
TEEP (Total Effective Equipment Performance) is a performance metric that provides insights as to the true capacity of your manufacturing operation. It takes account both Equipment Losses (as measured by OEE) and Schedule Losses (as measured by Utilization).
OEE Insights
Measures the percentage of Planned Production Time that is truly productive
Unleash your business with OEE analysis to maximize efficiency and drive growth. Enjoy a streamlined interface with detailed insights into each production line, presenting key metrics to evaluate and improve performance.
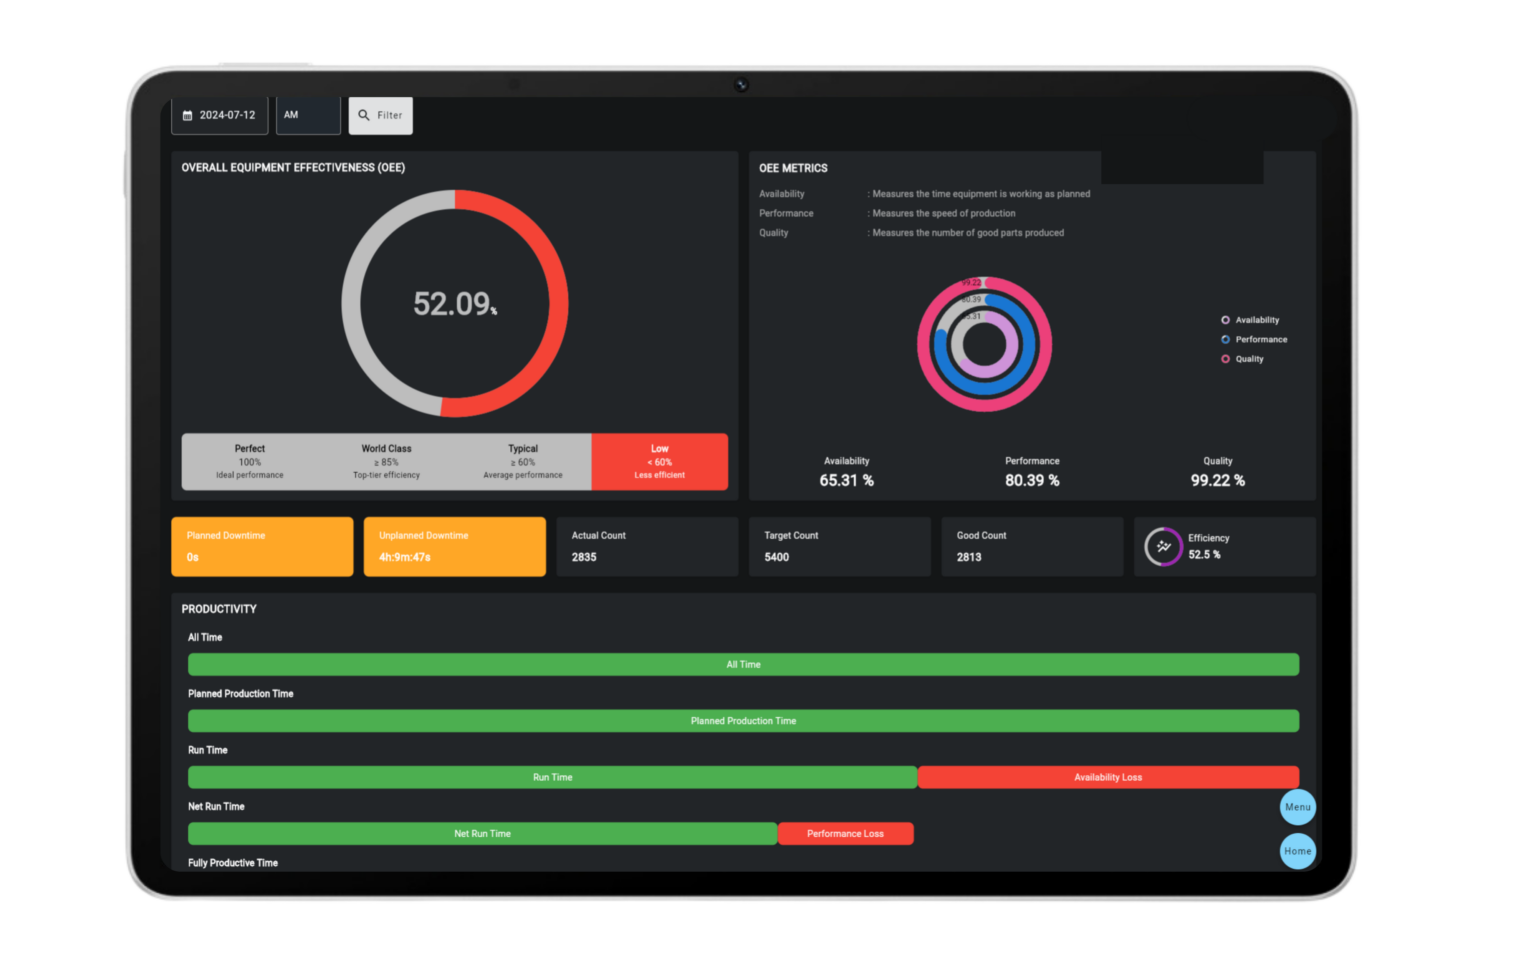
Smart TEEP/OEE status
Highlight status with suitable colour based on current OEE percentage.
TEEP/OEE factors
Understand the 3 underlying factors of OEE—availability, performance, and quality—along with the additional factor of utilization for TEEP
Quick review
Quickly review each type of loss and its relationship to the TEEP/OEE factors
Instant Downtime Tracking
Boost Efficiency
Downtime:
Auto Capture
The upgraded downtime feature automatically captures downtime, helping users reduce manual tracking efforts. Also have the option to add downtime manually when needed.
Downtime:
Manual key-in
This feature allows users to manually input downtime data into the system. It’s useful when specific details need to be added that aren’t detected by automated system.
Focuse Insights
Single Line Focus
Monitoring:
Real-time
The single-line monitoring provides one specific production line. It displays actual count, efficiency, shift details, and date information, along with a graph of actual counts. This focused approach allows for precise tracking and analysis of performance.
Better Together
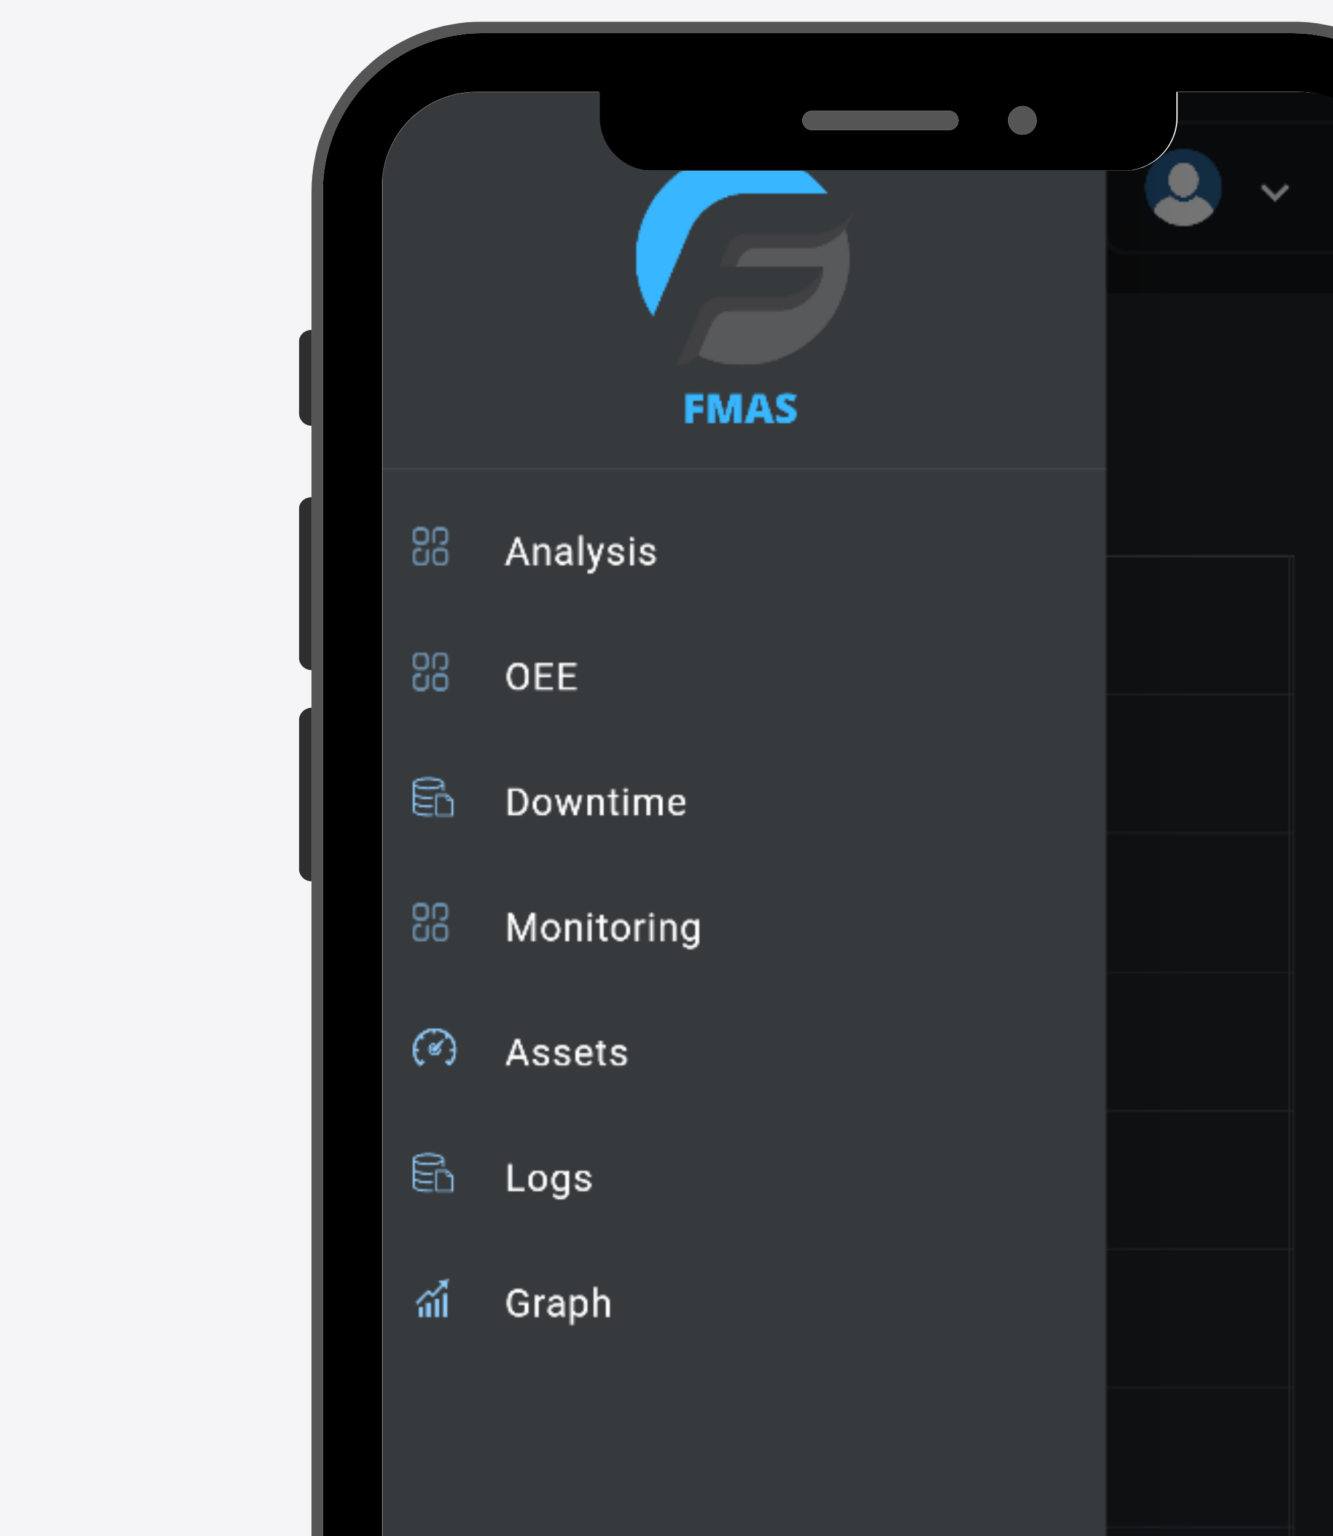
Assets
Display list of parameters name and value based on specific line and asset in a single block. You can filter real-time data based on different assets and parameters.
Logs
Logs displays all recorded data in a table format. Users can view, edit, or delete data as needed. You can filter based on date, asset, and parameter. This flexibility ensures that users can easily manage historical data for better analysis.
Graph
Displays all recorded data along with graphical representations for easy analysis. The graph provides visual insights into the log data, making it easier to identify trends and patterns for more informed decision-making.
Production Line Support
Boost your manufacturing efficiency with our easy-to-use
Production Line Support.
Helps you update, monitor and analyze each production line in real-time.