
Professional consultation with zero charge. Contact us
Intelligent Solutions
We provide software, engineering, data acquisition, and
industrial automation solutions tailored to your business needs.
- Dashboard
- Real-Time Assets
- HMI
- Report
- Alert
Dashboard
FMAS
Facility Management & Analytic System brings production, maintenance, utilities, and supply chain together in one connected platform customized to your needs.
Explore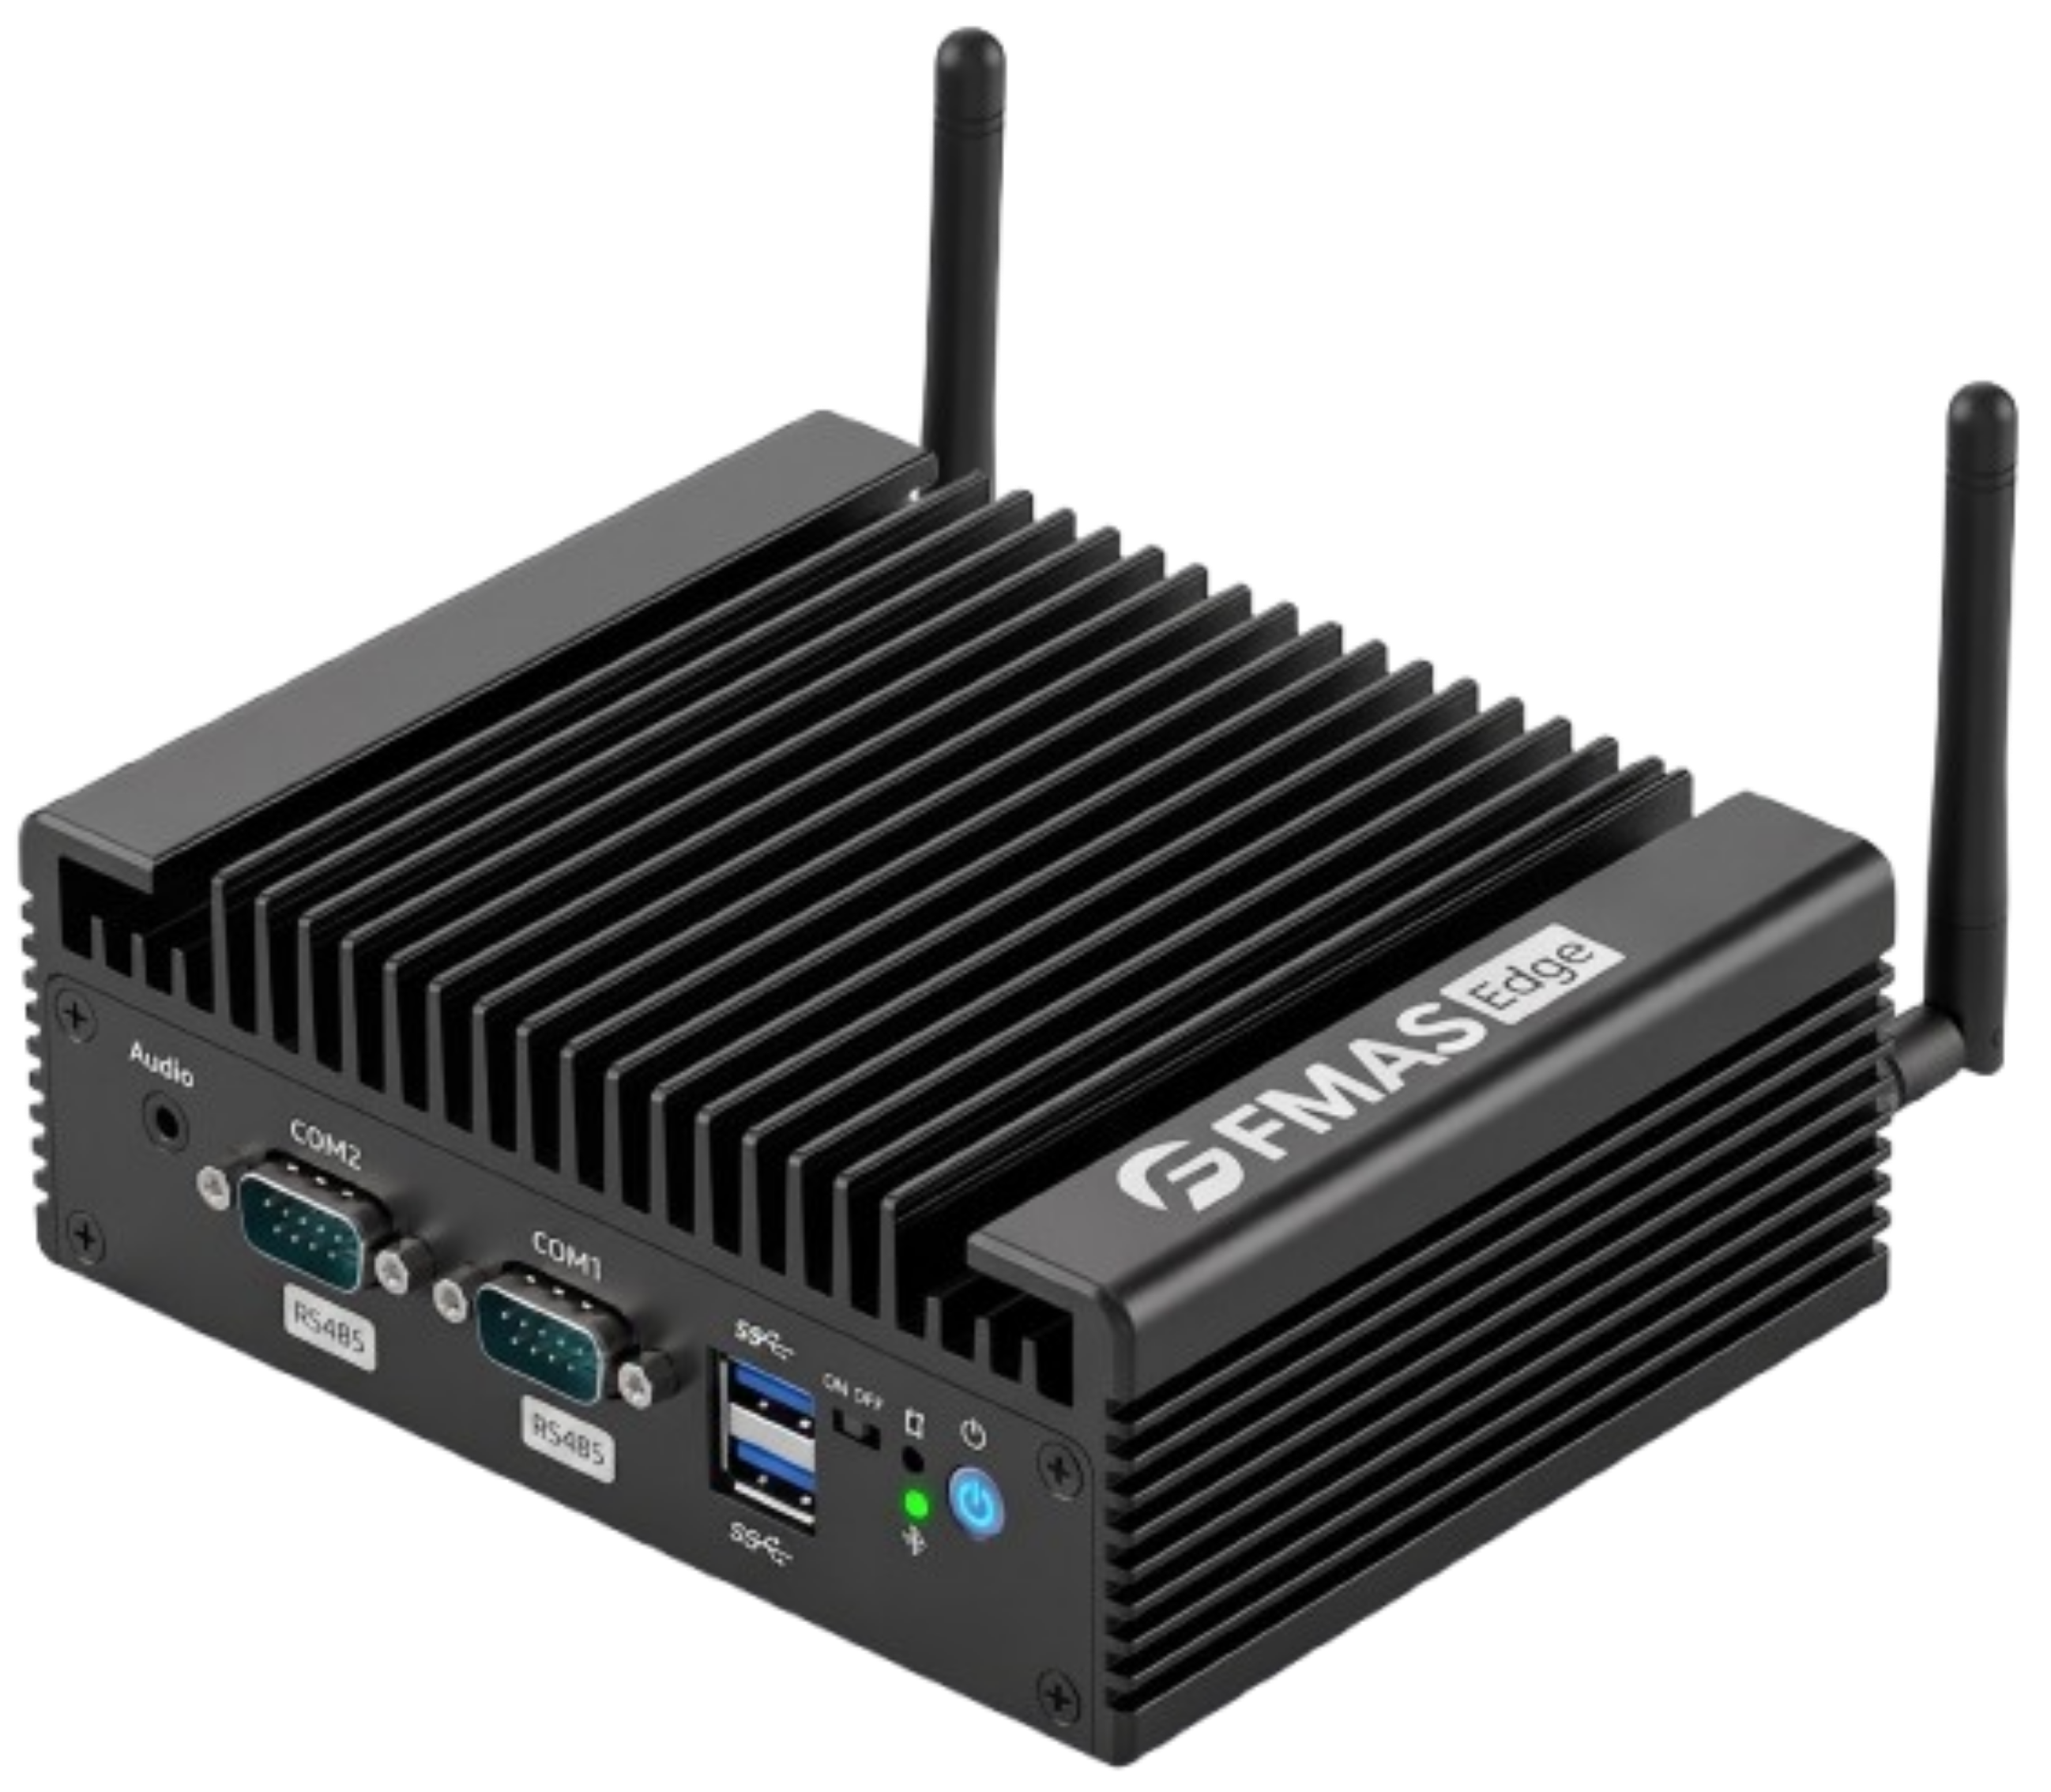
FMAS Edge
Industrial PC that connects your machines, collects data, and brings real-time visibility to your operations.
ExploreDashboard
Dashboards designed around your facility and industry — turning complex data into clear insights, built into FMAS or your existing systems.
Explore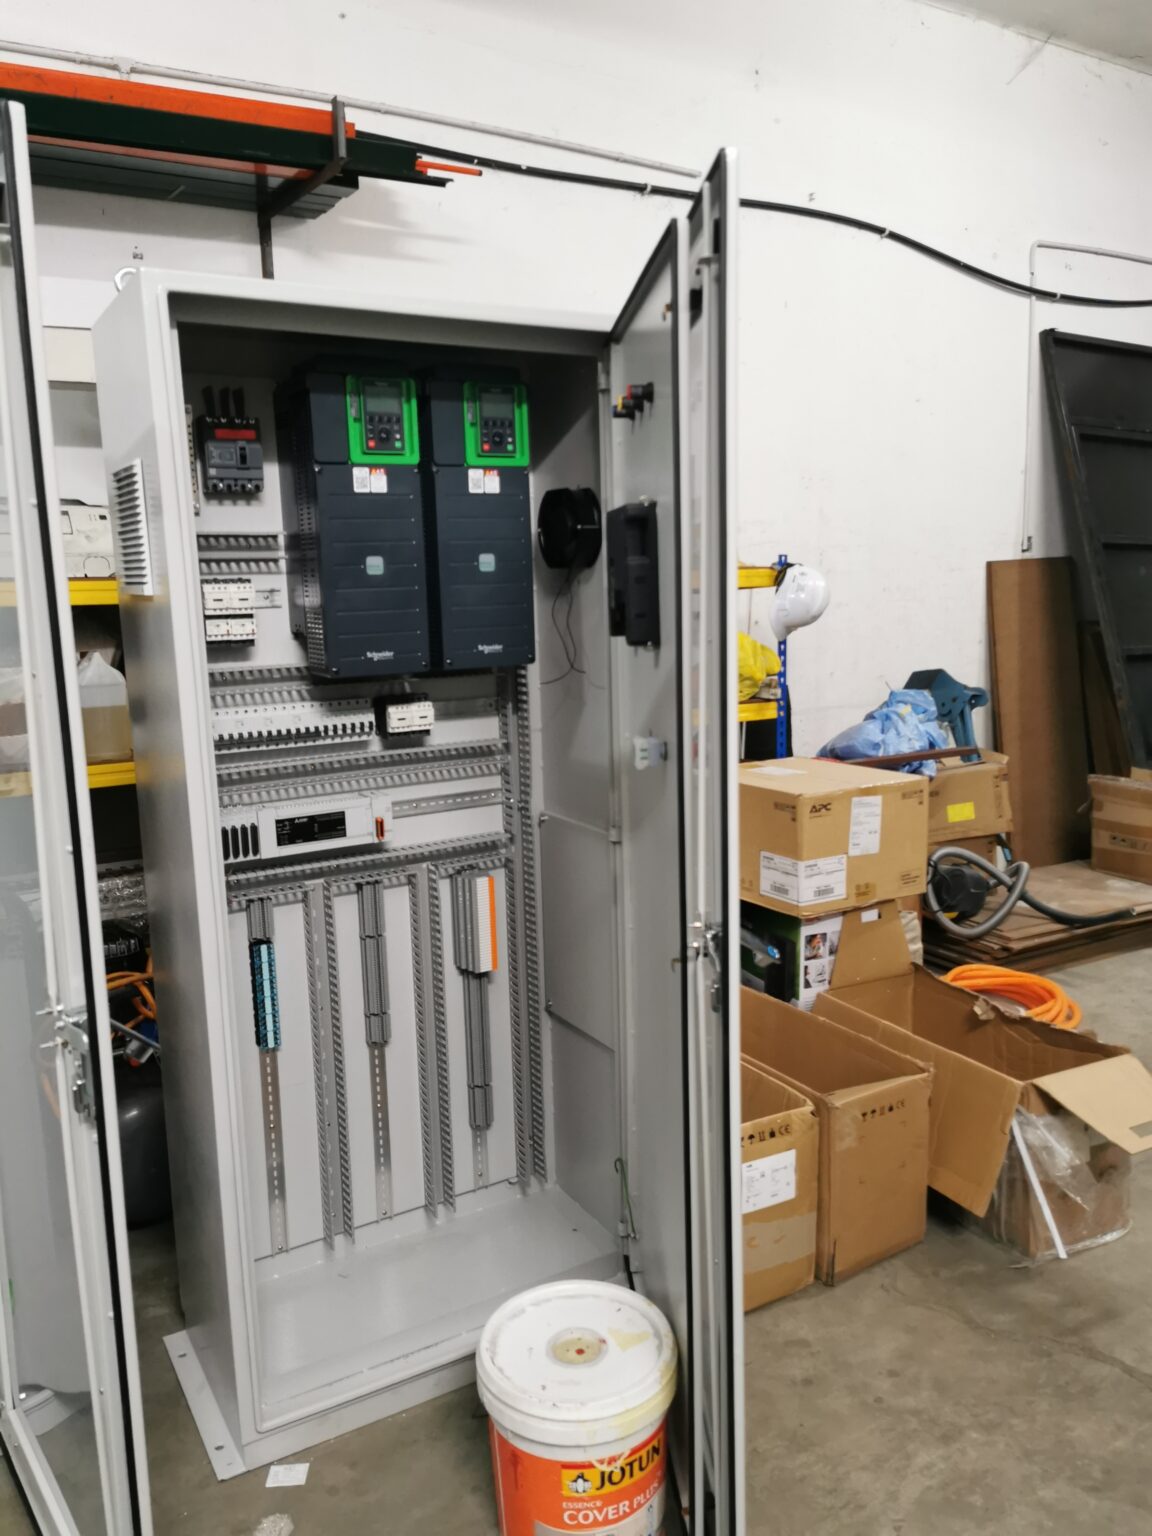
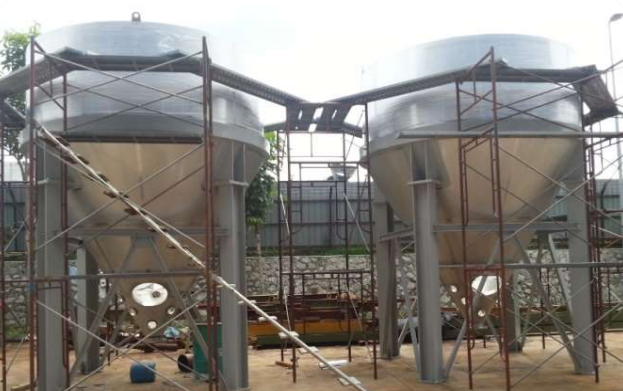
Services
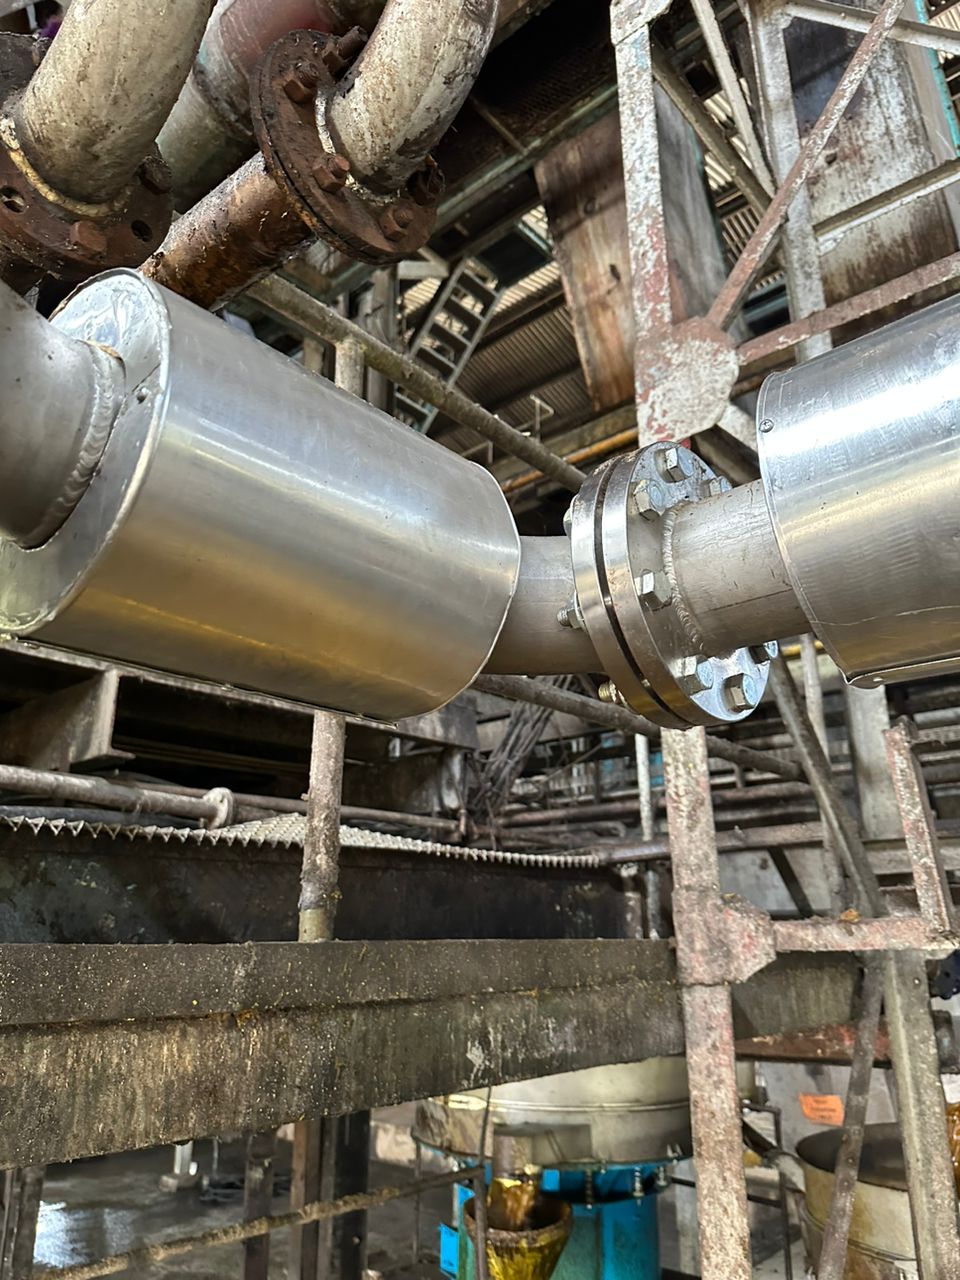
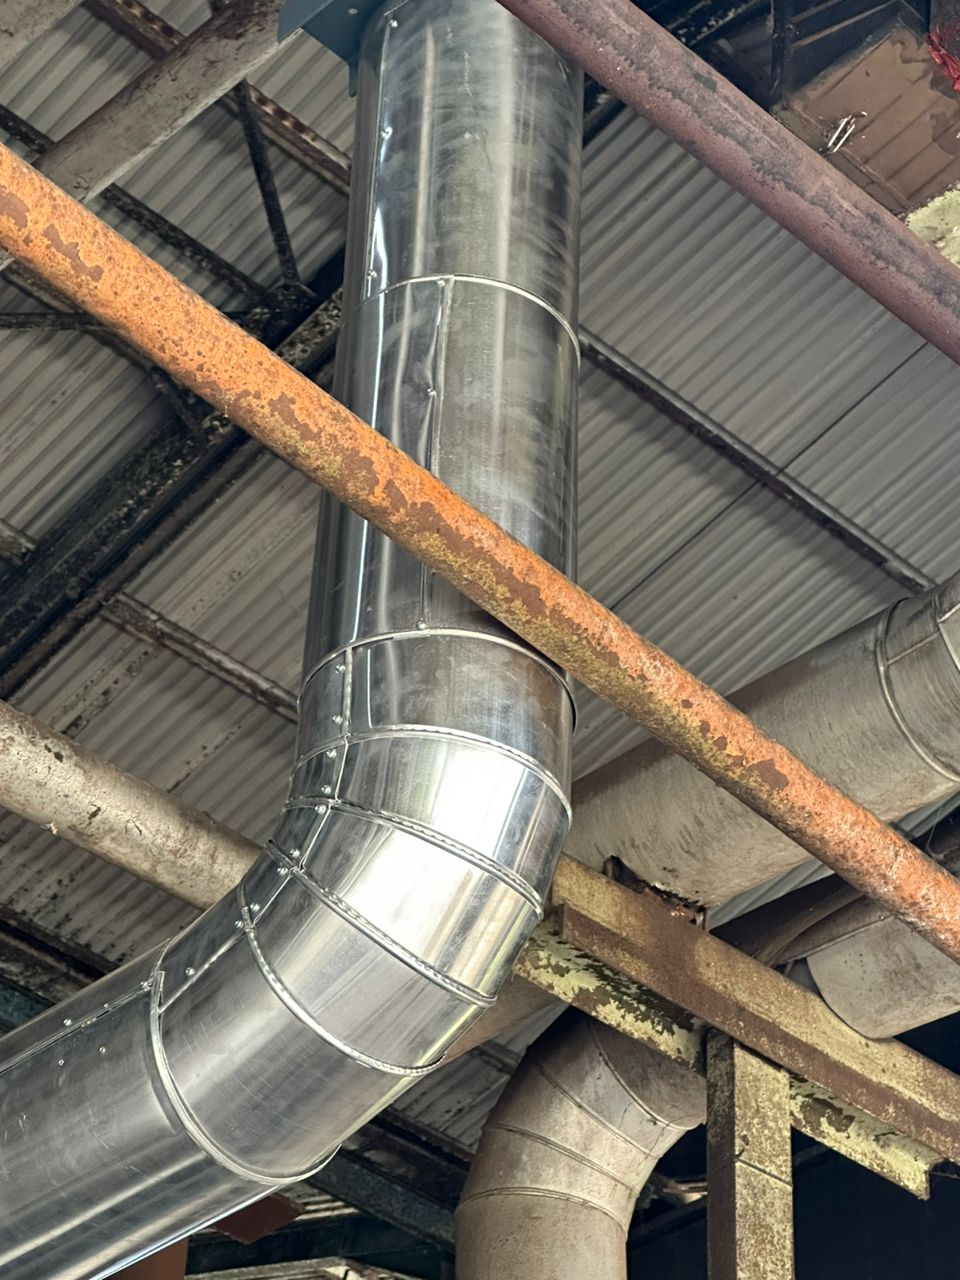
Industrial fabrication and engineering solutions for piping, insulation, hoppers, conveyors, and more.
ExploreAuto Laser
Cutting Machine
Automated laser cutting for fast, precise, and consistent results — reducing manual work and material waste.
ExploreCustom Solutions
Have a unique challenge? Let's discuss it. We work with you to explore, design, and develop solutions tailored to your needs.
Explore
Grow with
FMAS
Smart factories are only as strong as their foundation FMAS builds a unified industrial ecosystem from data architecture to user experience - ensuring every operation is connected, visible, and optimized.
FMAS Brochure ↓
Integrations
Files
Ask AI
I suggest checking it before it...
Production_Data.xlsx
Dashboards
Data records
Web-Based Access
Access FMAS securely from anywhere. Fully supported across multiple devices, so your factory floor is always within reach.
One Platform. Multiple System.
Built for Smarter Operations.
Powering every FMAS solution with essential capabilities across production monitoring, predictive maintenance, work order management, utility optimization, and production planning. These core capabilities form the foundation of FMAS, while each solution is enhanced with specialized functions designed to address unique operational requirements and challenges.
Core Features.
Across FMAS.
| 17:12:33 | WARN | Reject Spike (Sensor A2) |
| 17:12:31 | OK | Target speed reached |
| 17:12:28 | OK | Quality Check Passed |
| 17:12:25 | OK | Production Resumed |
| 17:12:20 | OK | Changeover Complete |
Real-time. Continuous and immediate monitoring of data, events, providing up-to-the-minute information. It involves the use of sensors, devices, or software that collect, analyze, and present data in real-time.
Reporting. The process of collecting, organizing, analyzing, and presenting data or information in a structured format for the purpose of convey insight. Also to communicate results, progress, or analysis effectively.
| Time (h...) | FT Washing | Filtering | |||||||||
|---|---|---|---|---|---|---|---|---|---|---|---|
| Contains | Contains | Contains | Contains | Contains | Contains | Contains | Contains | Contains | Load pr... | Squeez... | Squeez... |
| 22 | 0.05 | 0 | 2 | ||||||||
| 23 | 0.05 | 0 | 0 | ||||||||
| 0 | 0.05 | 0 | 0 | ||||||||
| 1 | 0.04 | 5.62 | 0 | ||||||||
| 3 | 4.8 | 0 | 3 | ||||||||
| 4 | 0.7 | 0 | 0 | ||||||||
| 5 | 5.04 | 0 | 2 | ||||||||
| 6 | 5.04 | 5.66 | 0 | ||||||||
| 6 | 0.03 | 0 | 0 | ||||||||
| A | B | C | D | E | |
|---|---|---|---|---|---|
| 1 | Time (h... | Process Status | Load pr... | Squeez... | Squeez... |
| 2 | 22 | Filling 🚨 | 0.05 | 0 | 0 |
| 3 | 23 | Cooling | 0.05 | 0 | 0 |
| 4 | 0 | Cooling | 0.05 | 0 | 0 |
| 5 | 1 | Filling | 0.04 | 5.62 | 0 |
| 6 | 3 | (notes) | 4.8 | 0 | 0 |
| 7 | 4 | Filtering | 0.7 | 0 | 0 |
| 8 | 5 | Filtering | 0.14 | 5.66 | 0 |
| 9 | 6 | Filtering | 5.04 | 0 | 0 |
| 10 | 6 | (notes) | 0.03 | 0 | 0 |
HMI. Apple Intelligence enables delightful ways to express yourself visually. Turn a rough sketch into a related image with Image Wand. And create new images based on descriptions.
AI Analysis. AI identifies potential issues early, helping you schedule maintenance before breakdowns occur.
AI Predictive Analysis
-
Anomaly Detected: Micro-vibrations in Bearing Assembly B exceeding normal operational thresholds.
-
Predicted Failure: 12 - 14 Days (85% Confidence).
-
AI Recommendation: Schedule downtime for bearing replacement and shaft realignment.
Find the Right
FMAS Solution
Choose the solution that fits your operational needs
> RUNNING
> LOGGING…
Scheduling Maint.
> RUNNING
> LOGGING…
Scheduling Maint.
Shop Floor.
On the
big screen.
We customize the display based on what your team wants to see.
▣ Big tv
Easy monitoring. Better control
👁 Live
Live production targets and output
▤ Graph
Know Your Production Trend
🛠 Install
Complete setup. Ready anywhere
Built Without Limits.
Laser Cutting
Custom laser cutting services tailored to your exact needs. We precisely cut and shape a wide range of materials based on your specific project requirements.
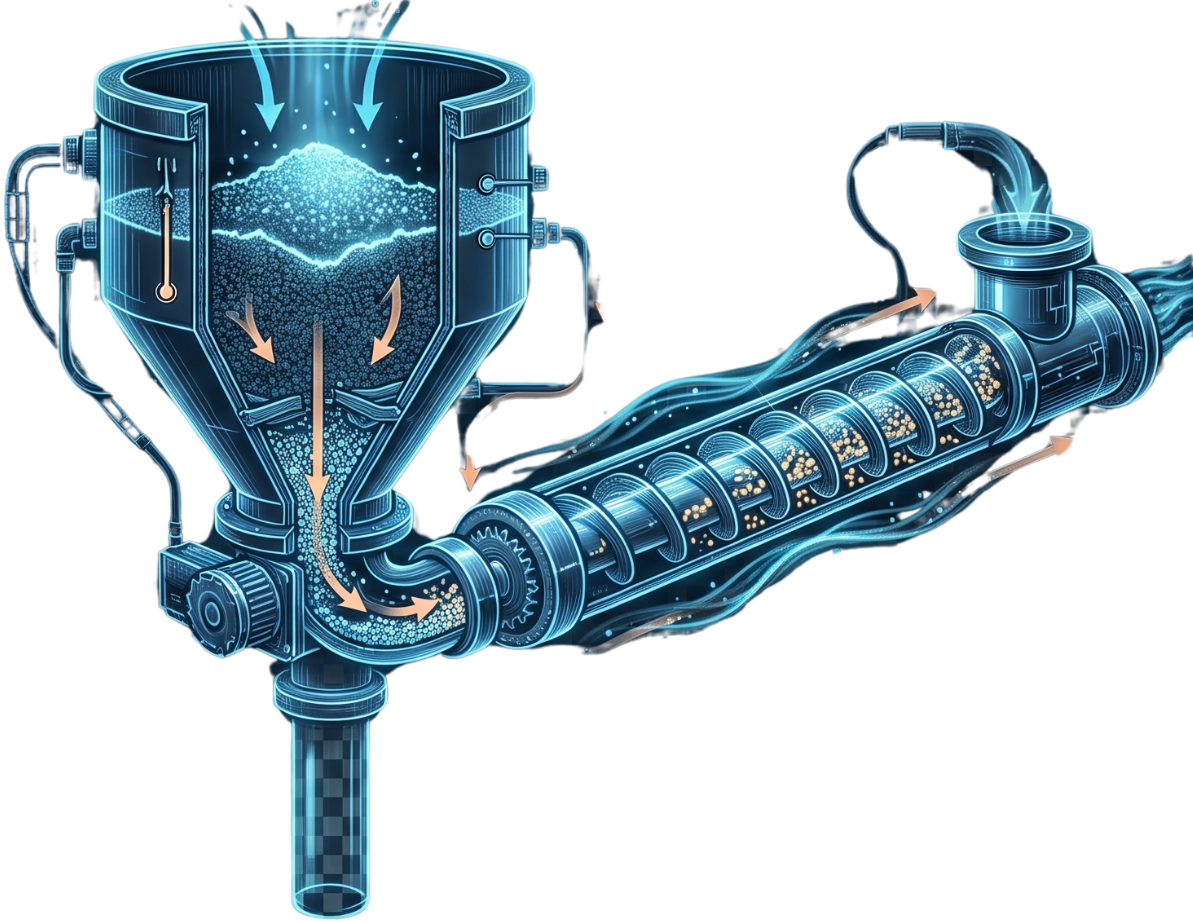
Hoppers & Conveyors
Keep materials flowing. Store bulk goods securely and move them effortlessly. Smart hoppers and automated conveyors team up to prevent jams, regulate flow, and run your production hands-free.
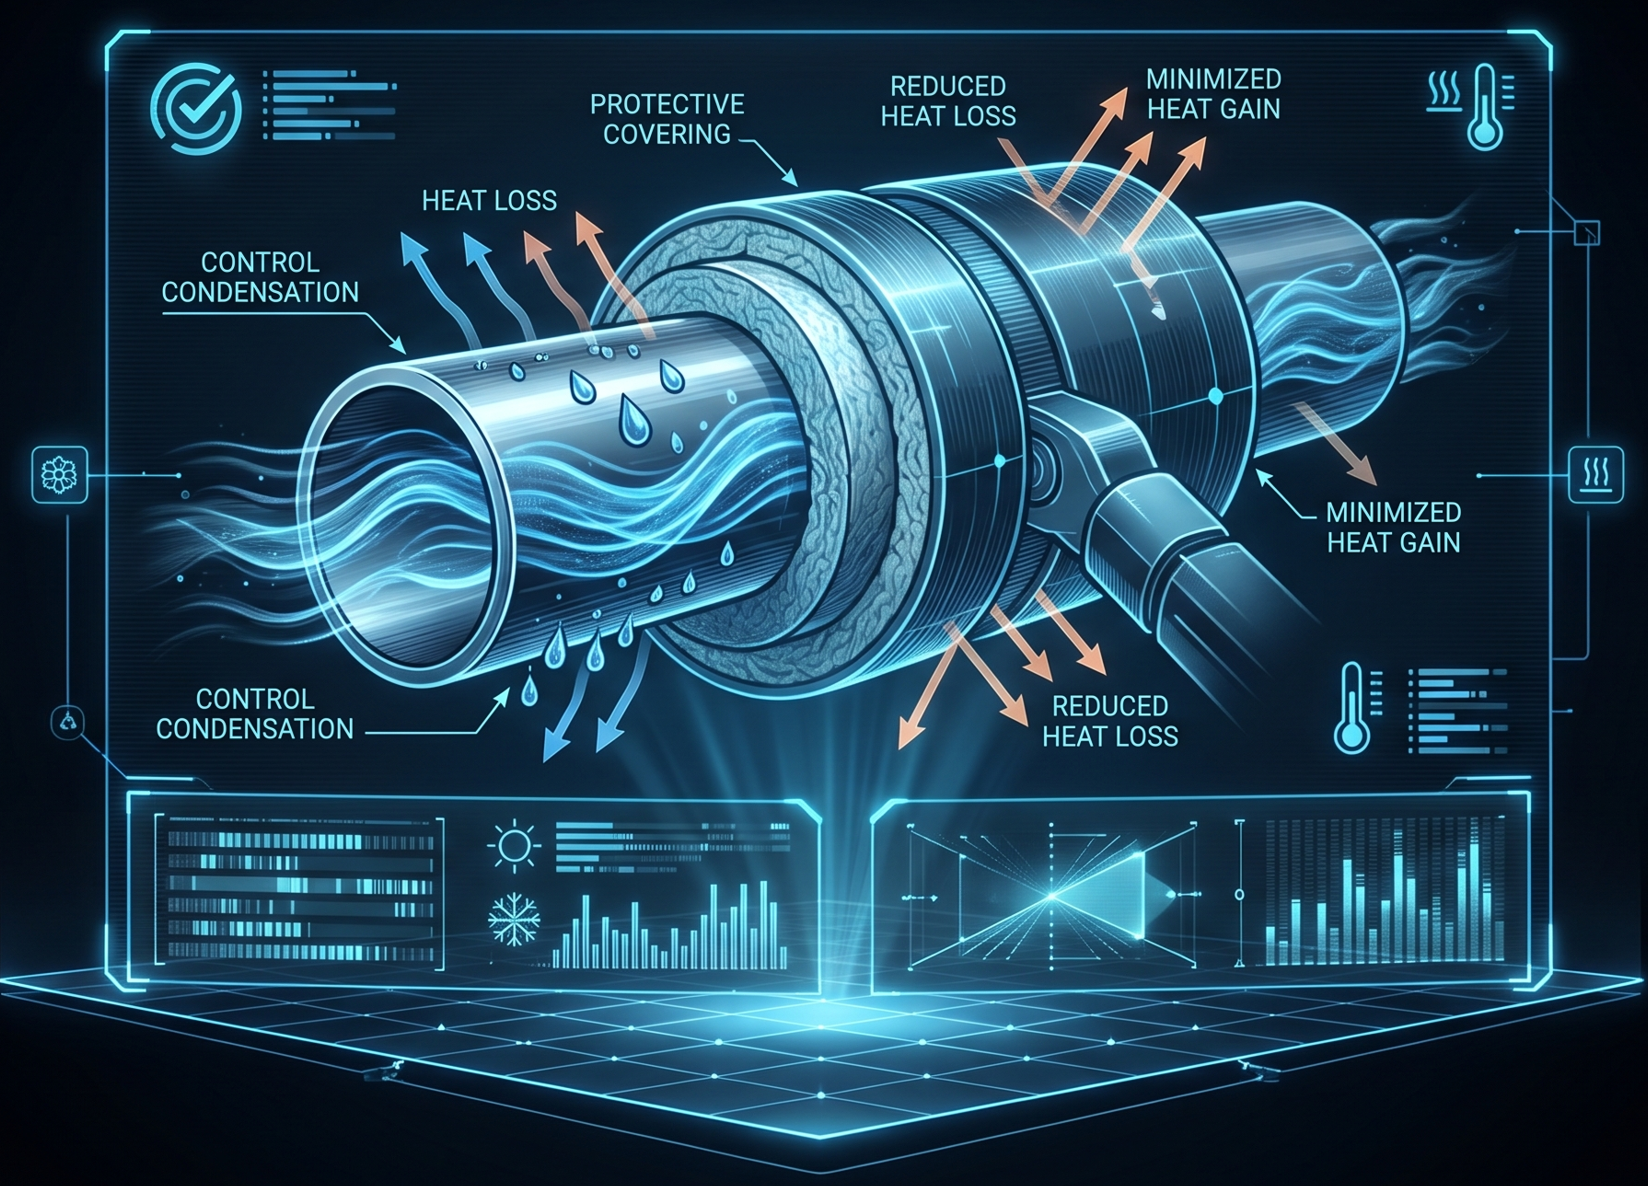
Piping Insulation
Keep temperatures under control. Save energy naturally. Piping insulation helps reduce heat loss, prevent condensation, and maintain stable temperatures throughout your system for long-term performance.
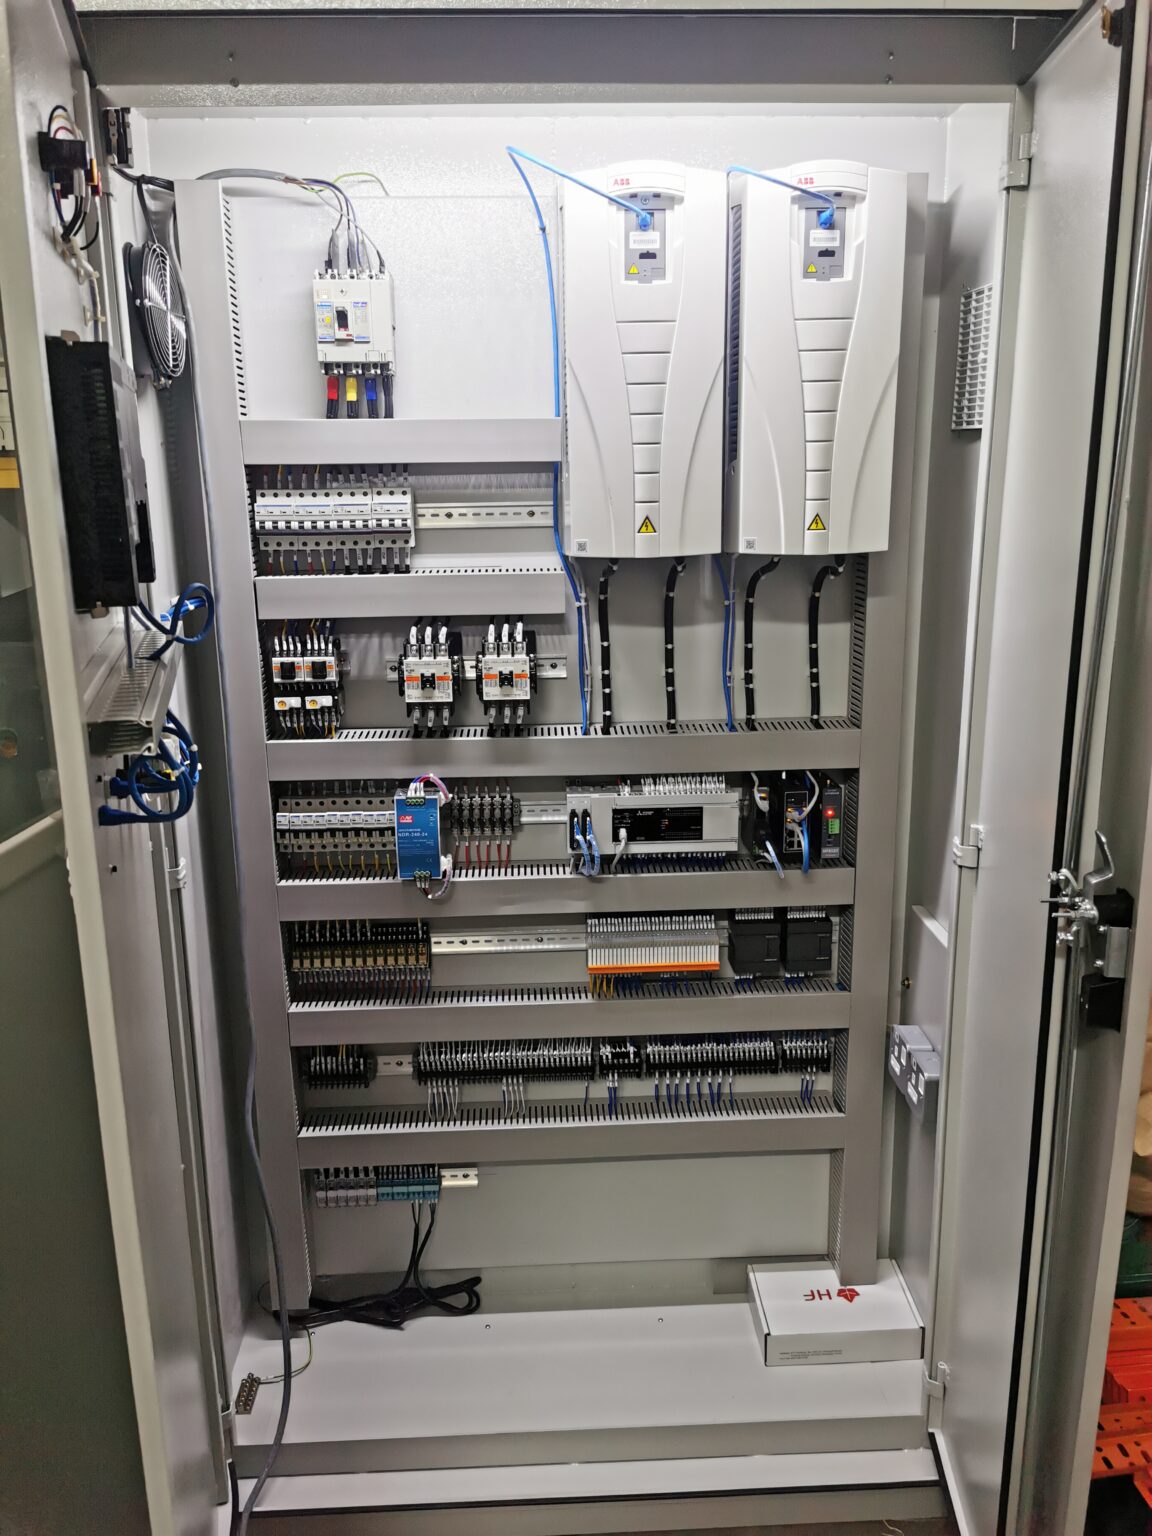
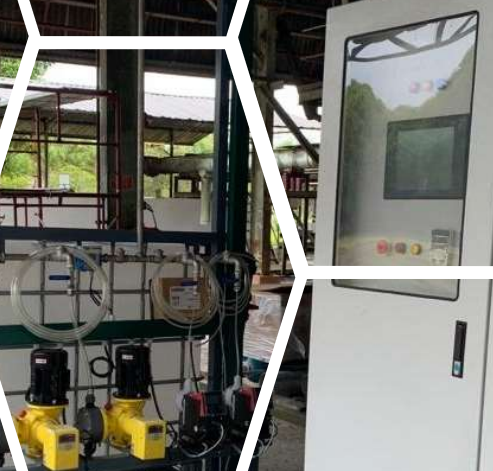
Control Panel Fabrication
Custom-fabricated control panels house electrical components and automation systems for efficient equipment operation, monitoring, and industrial process control.
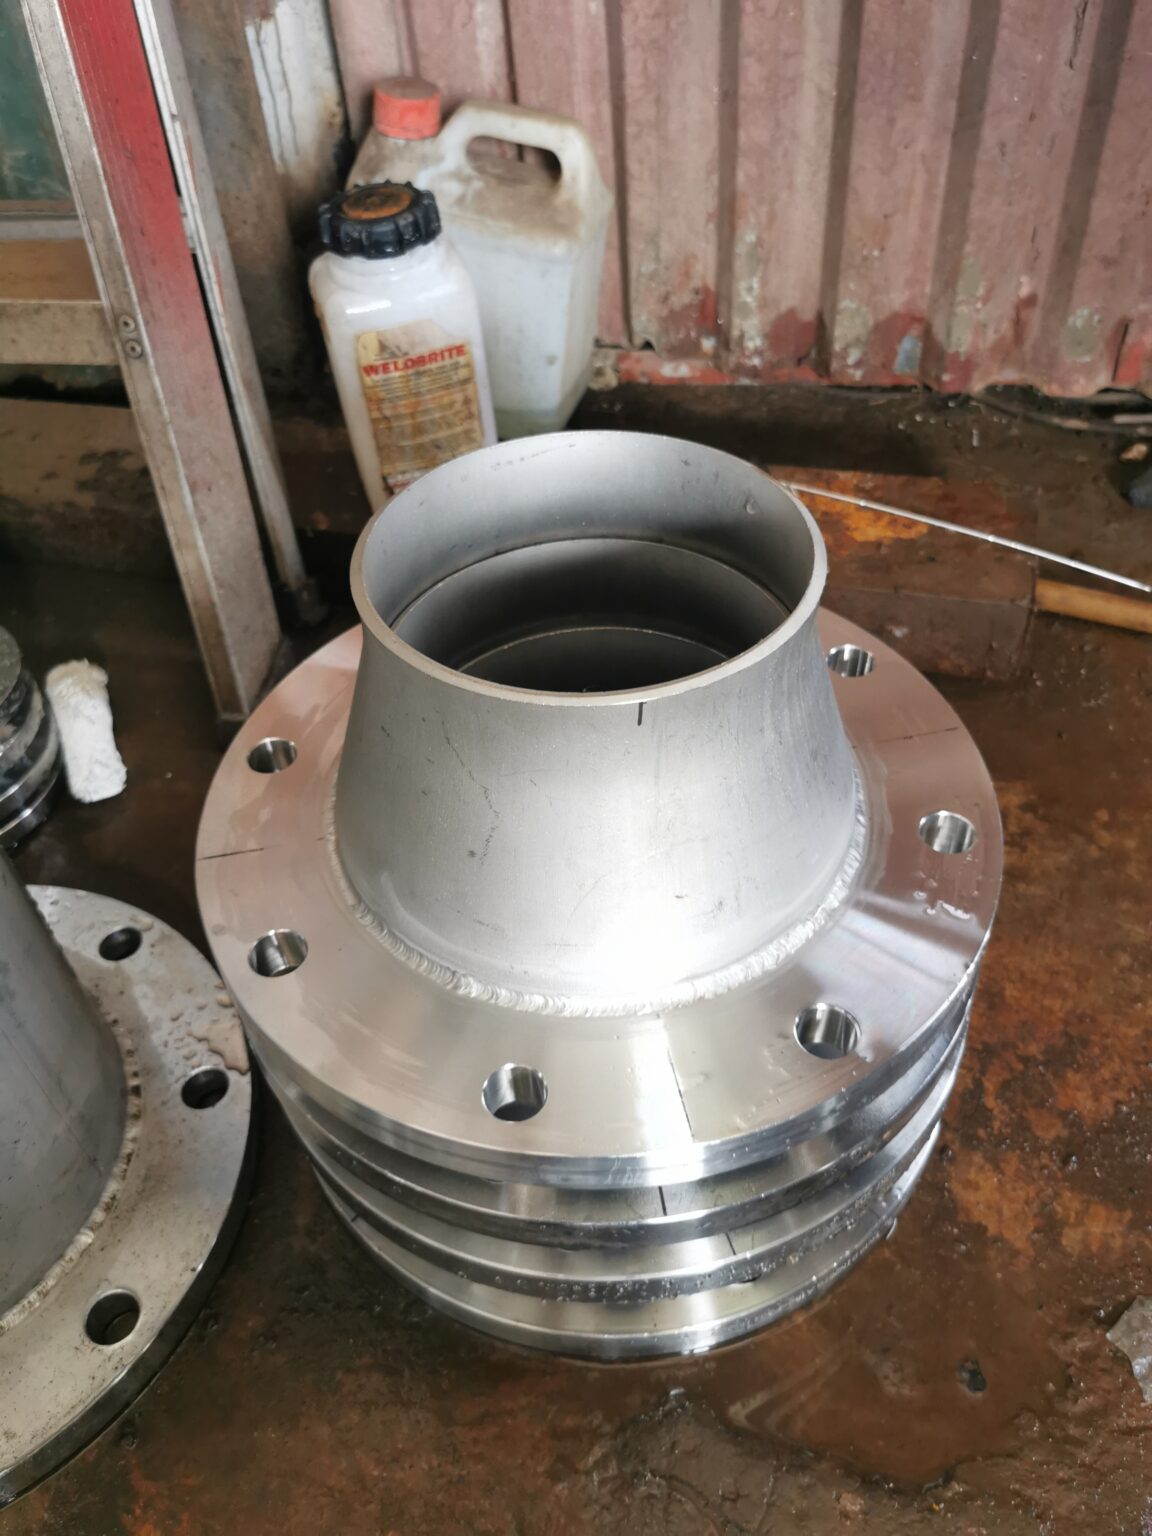
Workshop Fabrication
Custom-fabricated industrial equipment and components engineered for your production requirements — from individual process equipment to complete skid-mounted assemblies.
Explore Our Resources.
Company Profile
Company, expertise, industry experience, and the solutions we deliver.
Company Profile
FMAS
Smart manufacturing system for monitoring, analytics, and operational improvement.
Built for industry leaders and
fast-growing enterprises.







FAQ
Can you develop a system based on our specific requirements?
Yes. We develop custom systems and dashboards based on your business processes, requirements, and objectives. Whatever your needs, we can discuss, explore, and turn your ideas into a solution that works for your business.
What is FMAS?
FMAS is a unified smart factory platform that brings multiple systems together in one connected ecosystem.
What is FMAS Edge?
MAS Edge is an industrial PC designed to connect your machines, PLCs, and sensors with FMAS. It collects and processes facility data at the edge, with flexible hardware and capabilities that can be selected based on your operational needs.
Can your systems integrate with our existing legacy equipment?
Yes. Our IoT and SCADA integration solutions act as a bridge. We can pull data from both modern PLCs and older legacy machines, unifying your entire facility’s data into a single, cohesive dashboard.
What kind of reporting and analytics can I expect?
The platform delivers real-time data visualization and automated reporting. You can track performance metrics, monitor facility health, and generate professional technical reports tailored for stakeholders and management.
Are systems like POMS and PMS customizable to our specific industry?
Absolutely. While the core architecture is highly robust, the dashboards and data parameters can be tailored to track the specific KPIs, sensors, and operational flows unique to your manufacturing floor or facility.
How is the data secured?
All data transmitted from the edge devices to the central monitoring systems utilizes enterprise-grade encryption and secure protocols, ensuring your industrial data remains protected at all times.
Do you offer end-to-end custom solutions?
Yes. We handle the full spectrum of implementation—from custom software development (using robust frameworks like Angular and Flutter) to the physical, mechanical integration of sensors and hardware on the factory floor.
Can you build custom data visualization dashboards?
We specialize in creating clean, minimalist, and highly responsive digital interfaces. We utilize advanced charting libraries to translate complex industrial data into clear, actionable visual insights that are easy for operators to understand at a glance
What level of support do you provide post-installation?
We offer comprehensive support covering both software updates and hardware troubleshooting. Our goal is to ensure your monitoring systems run continuously and scale seamlessly as your facility grows